Peptide Synthesis for Beginners
Experimental techniques involved in solid-phase peptide synthesis include a range of potential hazards related to both the chemical reagents and equipment employed. The material on this site is intended for researchers who already have training in and familiarity with the principles necessary for working safely in an organic chemistry laboratory.
Appropriate care should be taken in the use and disposal of all chemicals, referencing the corresponding materials safety data sheets, MSDS, as well as relevant policies and procedures set by an individual researcher's lab and organization. Suitable personal protective equipment, PPE, should be employed at all times, and a certified fume hood used where appropriate. Additionally, following standard safety practices, the researcher should not work alone in the laboratory. The American Peptide Society does not assume any liability for the actions of users of the provided information.
The procedure herein describes manual Fmoc Solid Phase Peptide Synthesis, SPPS. Fmoc is the most commonly employed protecting group for the alpha-amine during peptide synthesis on the solid phase. Alternatives to Fmoc SPPS exist but are not discussed here.
Setting Up
Equipment and supplies needed. See the bottom of this page for an alternative setup.
If this is your first time synthesizing a peptide on solid phase and you do not have access to an automated peptide synthesizer, you will need access to the following:
Disposable fritted cartridges and caps. For example, empty standard SPE cartridges with 20 μm PE frits from Applied Separations can be used. A 3 mL cartridge size is typically good when working with 100 mg of resin and 1 mL of solvent. If you anticipate needing more than 1 mL of solvents or are planning on using volatile solvents, you may want to use a 6 mL cartridge size instead. Because spills occasionally happen, it is a good idea to cover the tray with aluminum foil and/or place your cartridge in a small plastic bag.
An orbital shaker or any small vortex mixer equipped with a microplate tray accessory. The tray makes it easier to gently agitate multiple cartridges and secure them in place with rubber bands. Note: Magnetic stirring will damage the resin and should be avoided.
An Erlenmeyer flask with side arm connected to a waste trap and water aspirator vacuum for draining of the reagents and solvents.
Access to an LCMS and preparative HPLC for analysis and purification.
Access to a lyophilizer for freeze-drying of your HPLC fractions.
With a scale of approximately 100 mg of resin, if you are using resin with high loading, for example 0.6–0.8 mmol/g, and synthesizing a pentapeptide, MW approximately 800 g/mol, you can expect approximately 50 mg of crude peptide material after cleavage from the resin.
A typical yield after purification for a peptide using standard Fmoc amino acids will be approximately 30–40%, resulting in approximately 15–25 mg of pure peptide material at the end of the synthesis and purification.
Depending on your peptide and resin, you might need to adjust the scale of your reaction in the future to get enough material for your desired application.
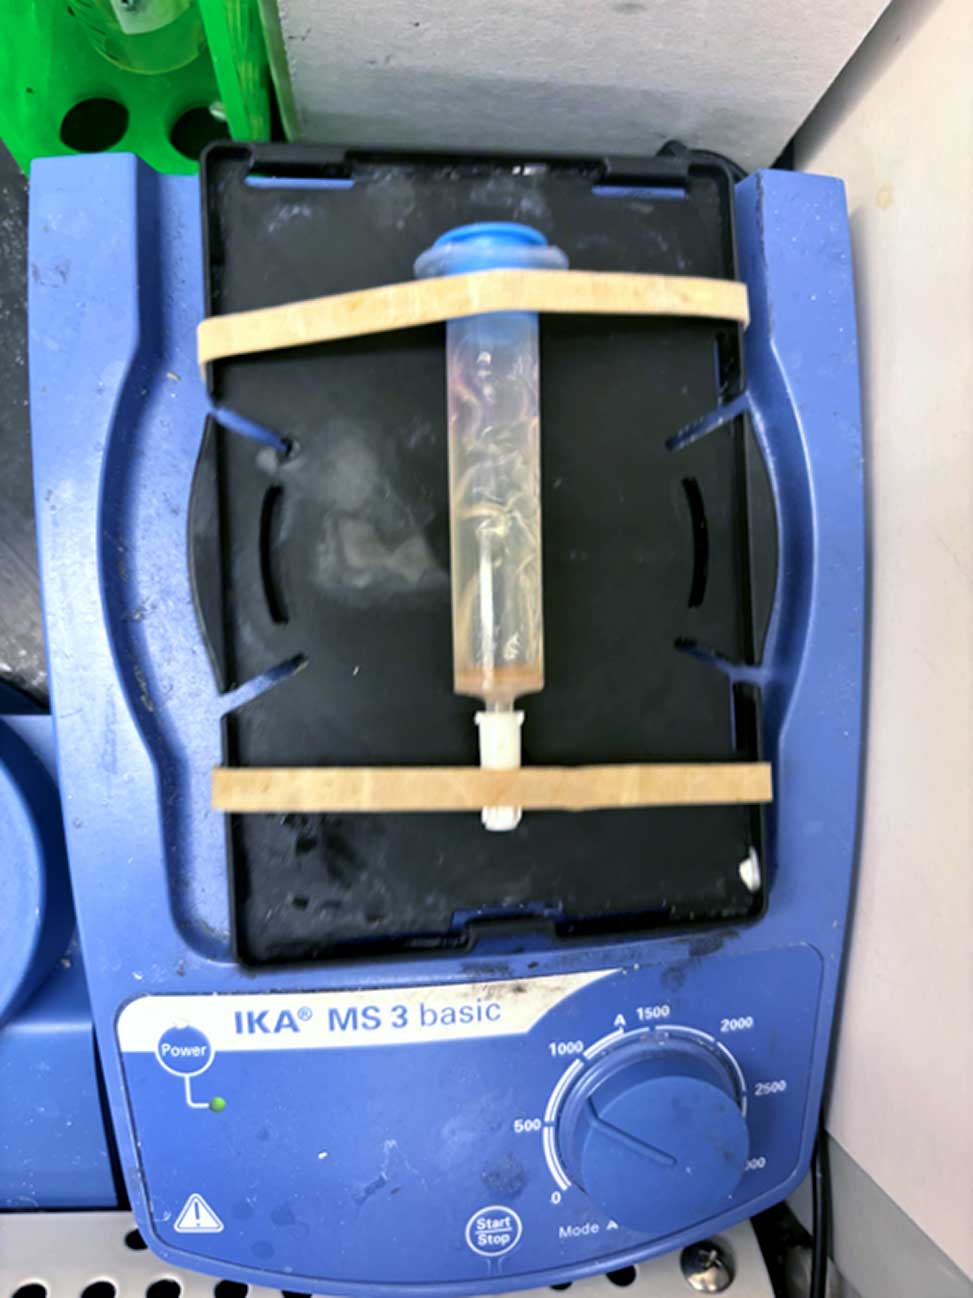
Resin in SPPS cartridge on a vortex mixer equipped with microplate tray
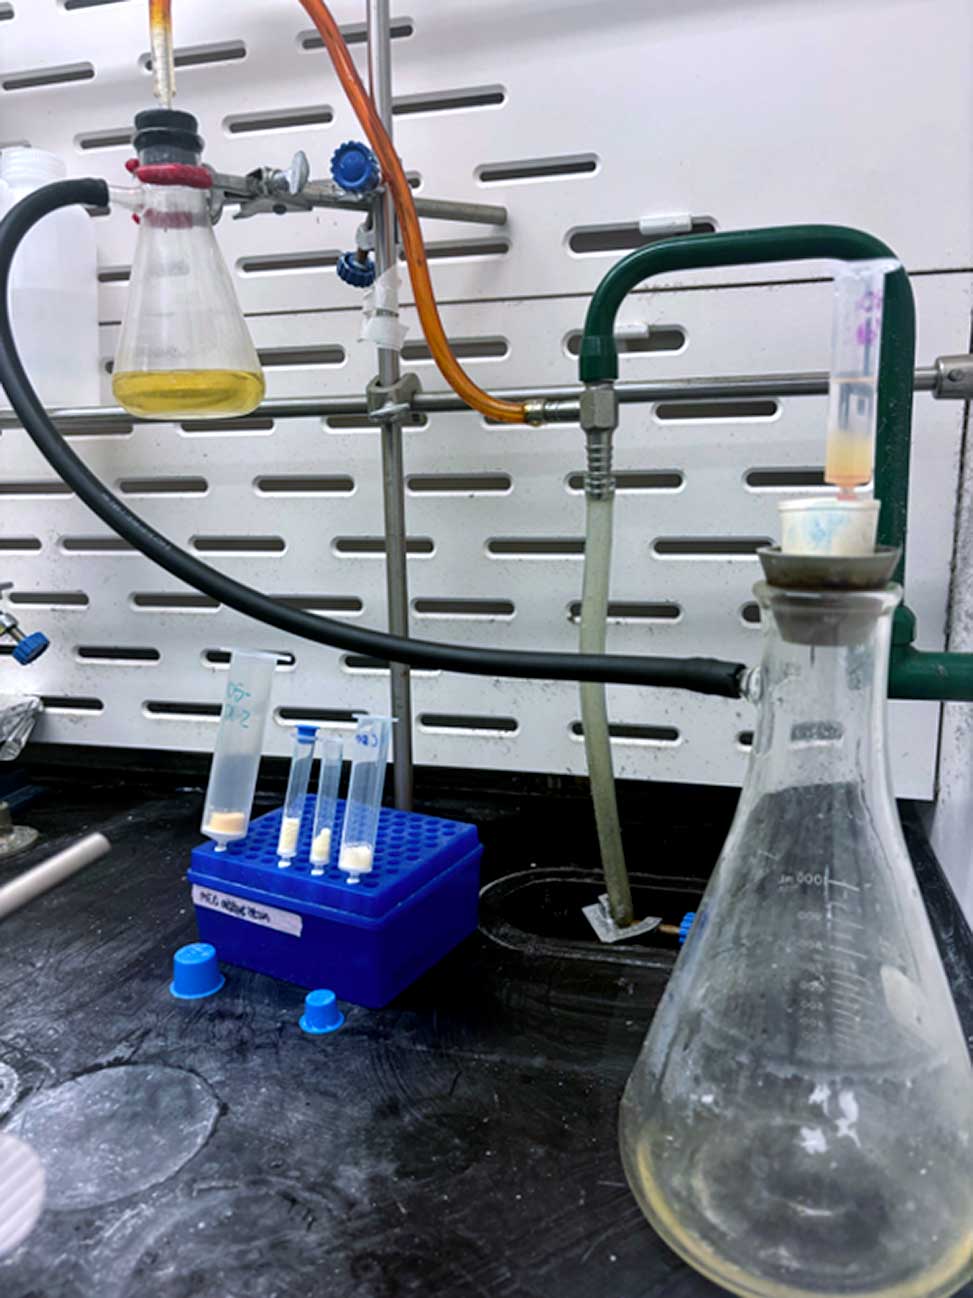
Setup for draining of the reagents and solvent
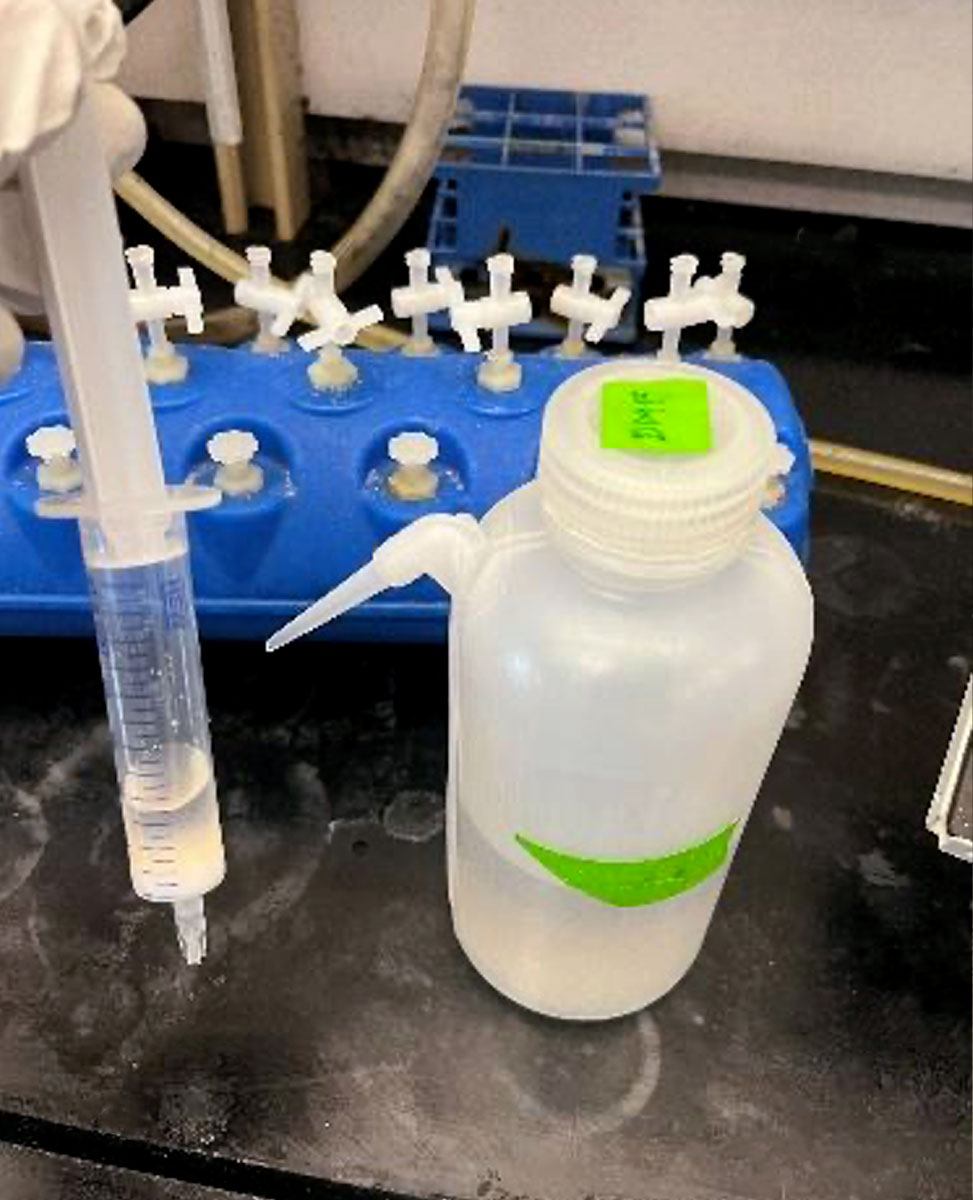
Alternative Manual Peptide Synthesis Setup
This setup parallels the components shown in the main description, with the chemistry and procedures largely reproduced using the apparatus shown below. The hope is that some users of this site might find certain components or reagents helpful or advantageous based on their unique environment. This setup can be easily adapted to the synthesis of many peptides in parallel.
Necessary Components
Fritted Syringe with Plunger
We typically use a 10 mL syringe from Torviq for syntheses up to 200 micromole scale. Caps to seal the bottom of the syringe to avoid unwanted leakage are also needed. We use AirTite Syringe Caps, #8300018835.
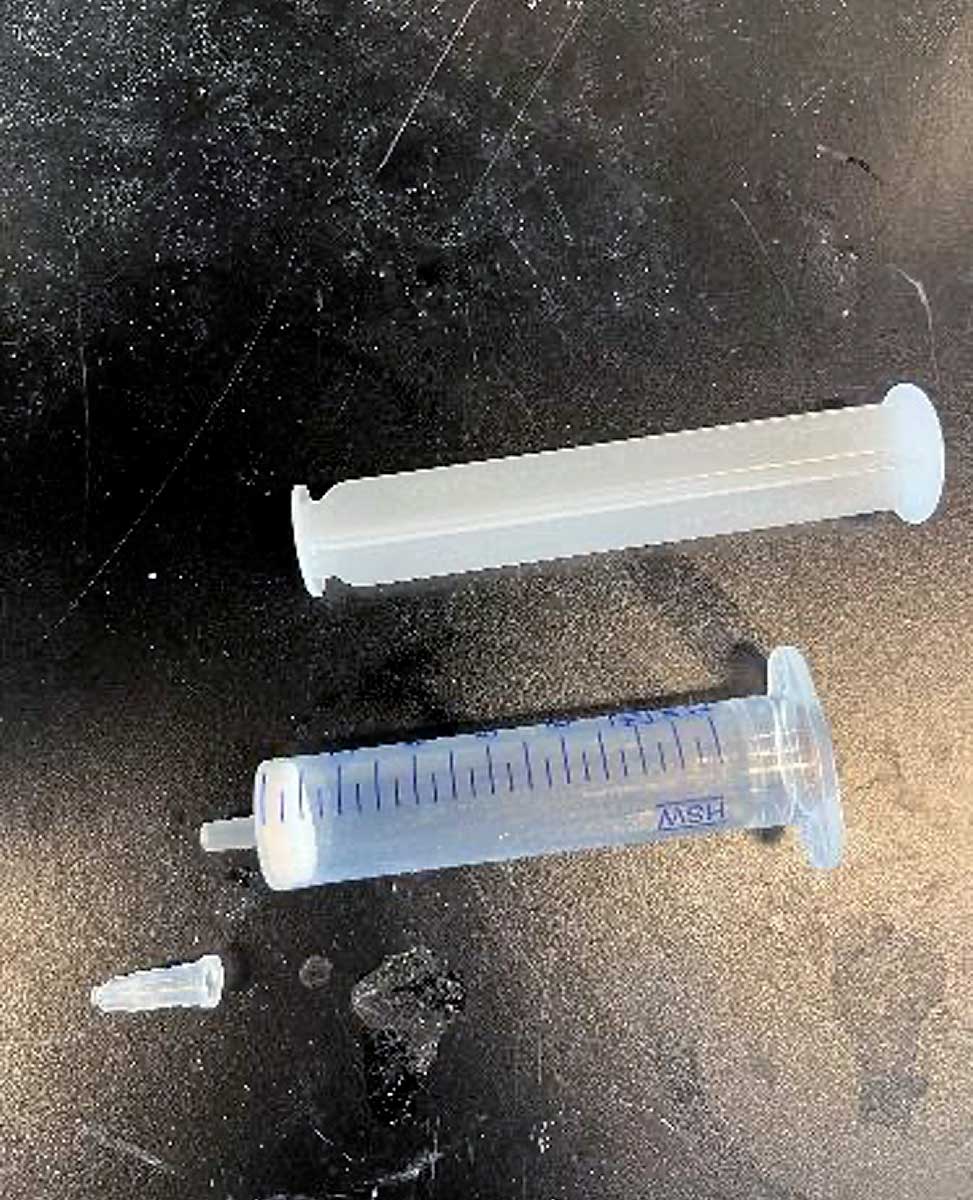
Fritted syringe component
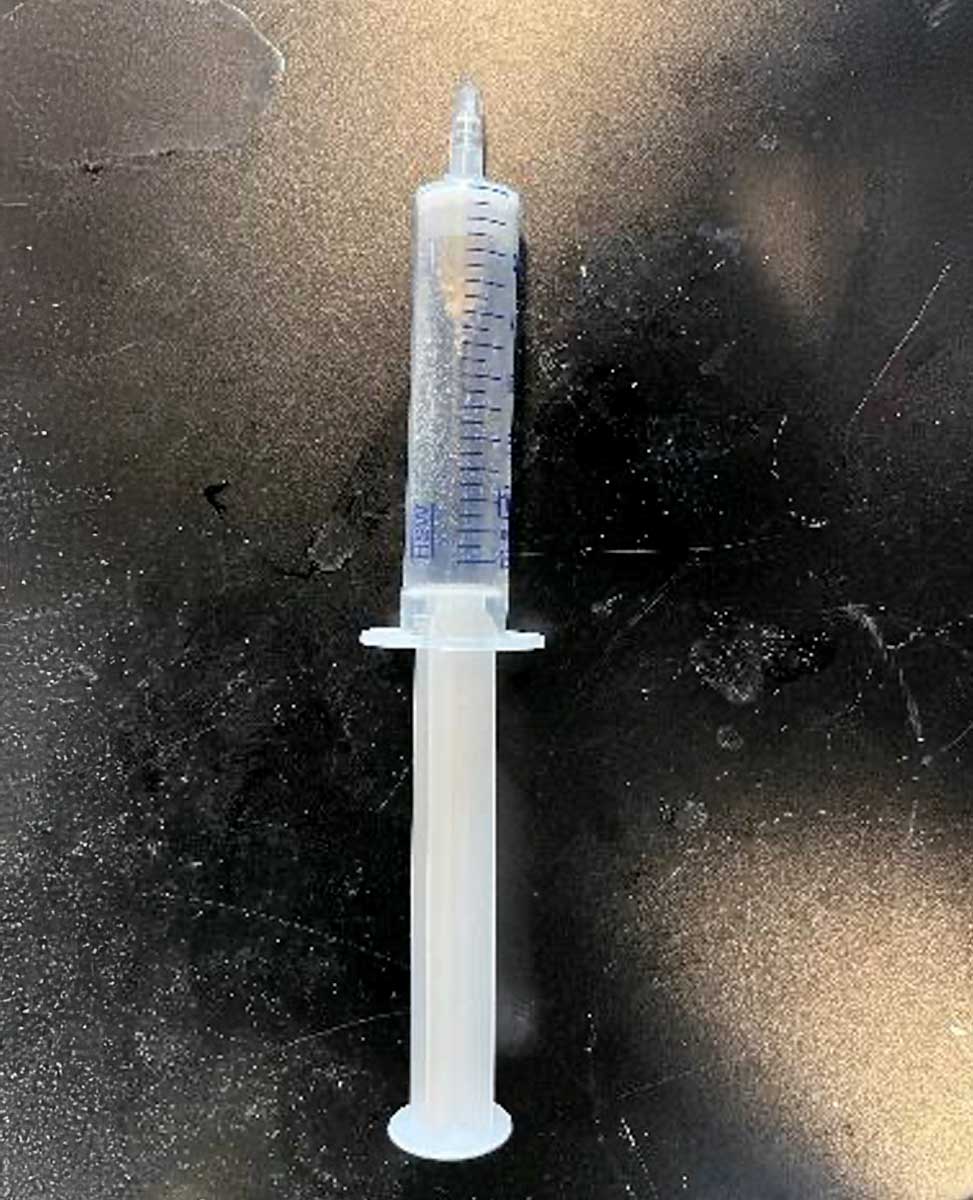
Fritted syringe component
Fritted syringe component
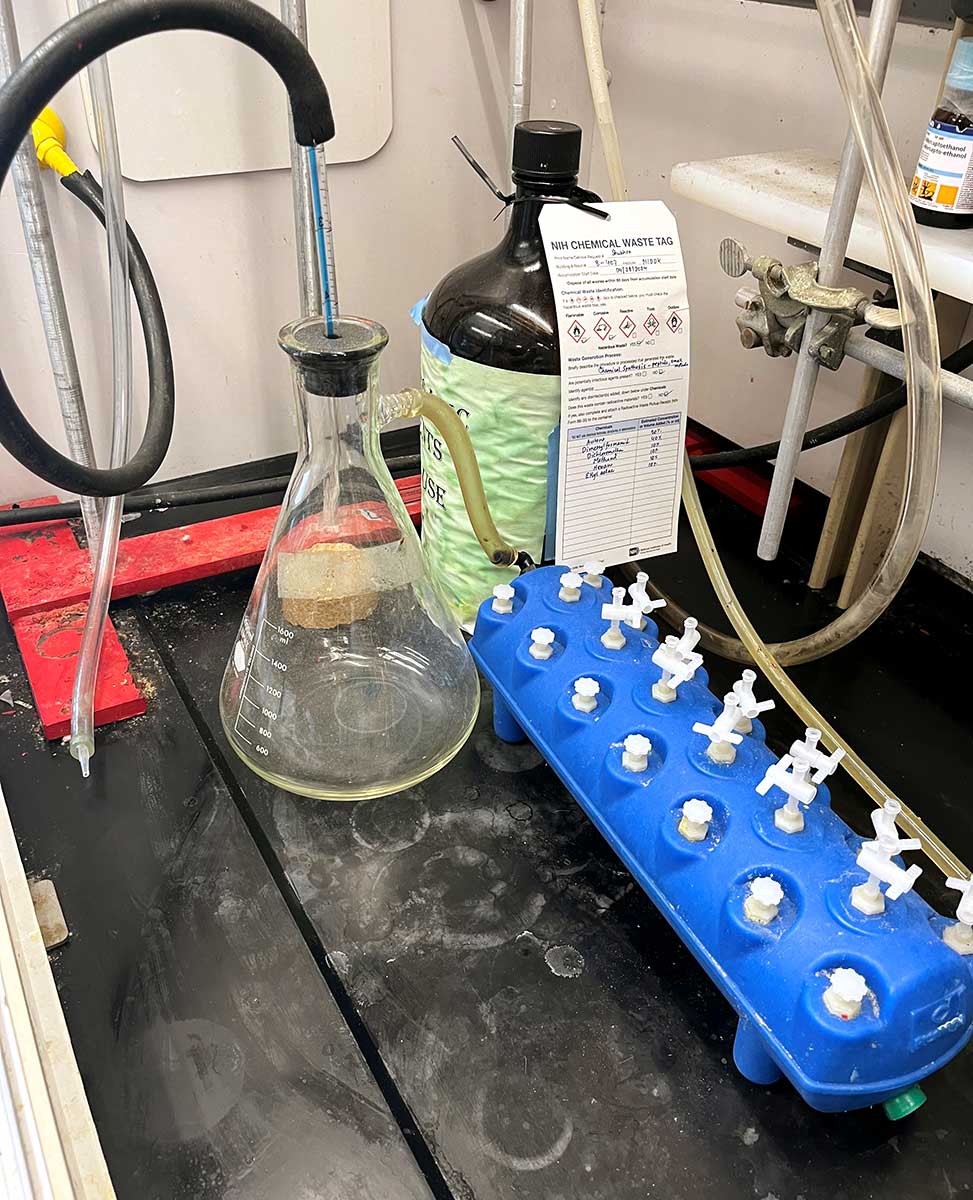
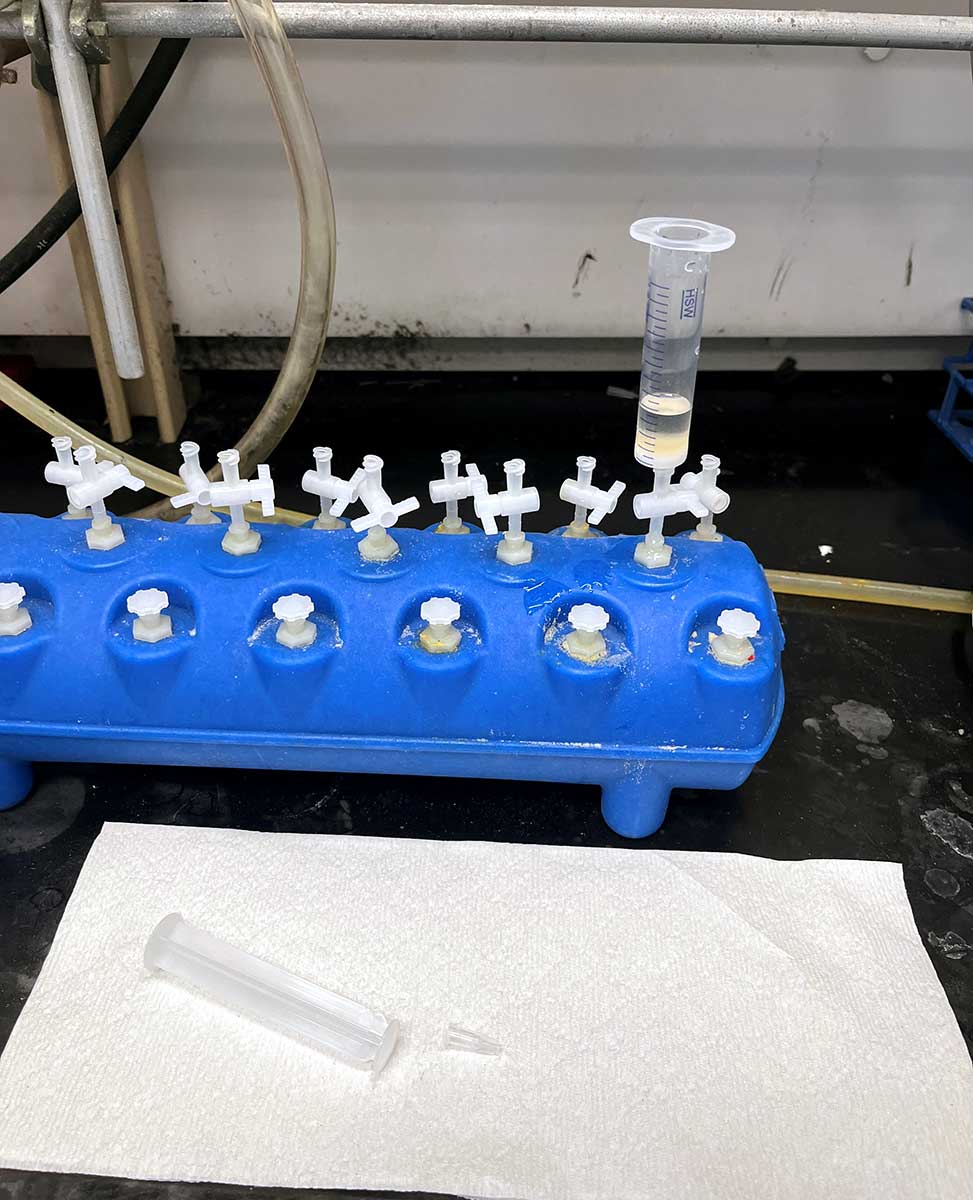
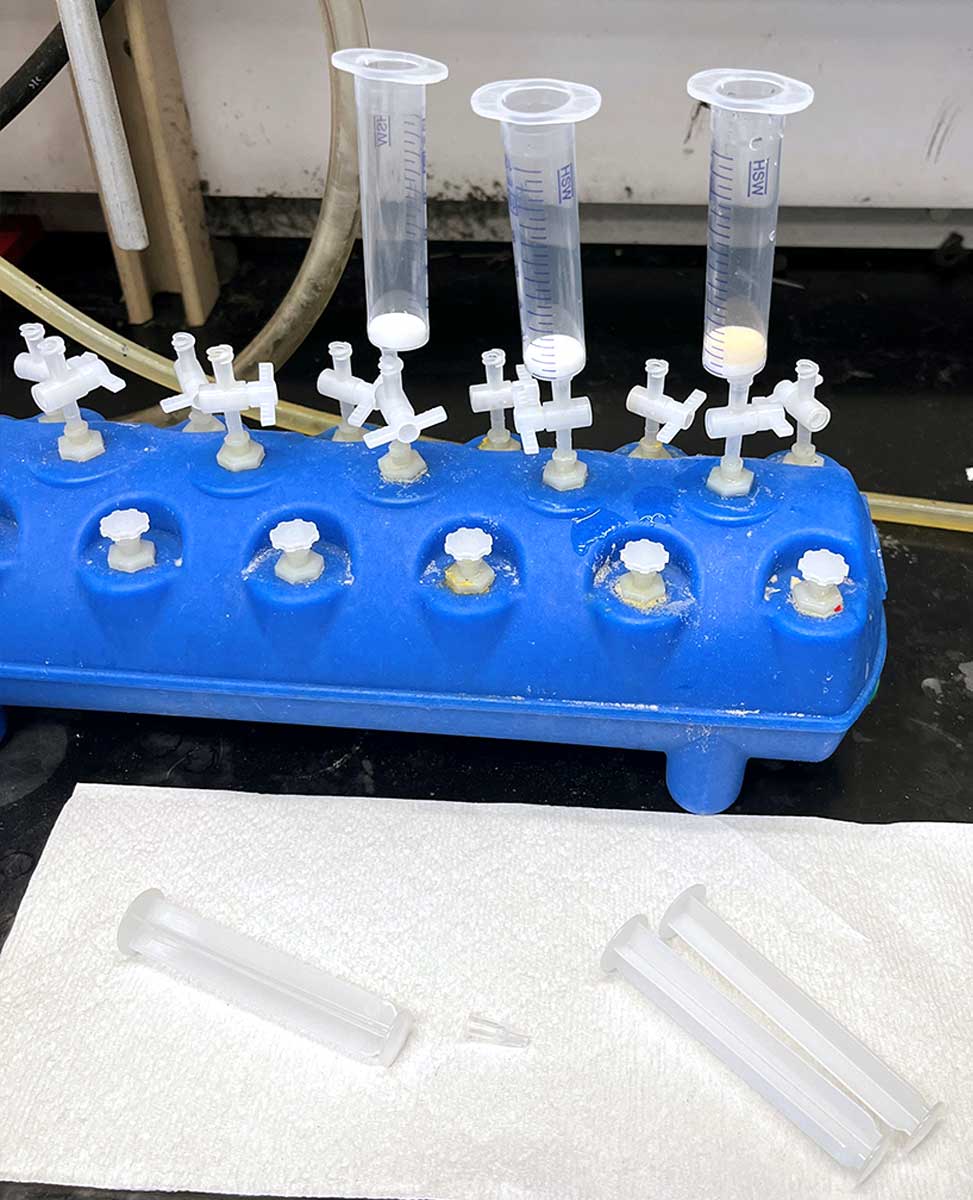
Vacuum Manifold and Vacuum Source for Solvent Aspiration
Removing solvent from the fritted syringe can be slow if relying on gravity. We speed the removal of solvent by placing it atop a manifold hooked up to a vacuum source. We have found success using the Vac-Man® Laboratory Vacuum Manifold from Promega. The attached reservoir stably holds common solvents used for peptide synthesis, DMF, dichloromethane, et cetera, but it has not been tested with reagents such as trifluoroacetic acid. A vacuum source should be connected to the vacuum manifold to accelerate solvent removal. As shown below, we connect to a house vacuum, although other vacuum sources should work fine.
Click to view a resin washing video
Important Note: The vacuum adaptor stopcocks provided with purchase are not stable to organic solvents. These must be replaced with a valve that is stable to organic solvents, such as Phenomenex A81213.
Vacuum manifold component
Vacuum manifold component
Vacuum manifold component
Mixing Apparatus
To ensure sufficient agitation of the resin we use a nutating mixer, such as VWR 82007-202. This type of mixing allows for sufficient mixing of resin with small volumes of solutions, deprotection or coupling solutions. We have gone down to 2 mL in a 10 mL vessel without issues.
Click to view a mixing device video
Caution: HBTU is a sensitizer and allergen and many researchers have developed sensitivities to this reagent. See "Anaphylaxis Induced by Peptide Coupling Agents: Lessons Learned from Repeated Exposure to HATU, HBTU, and HCTU." Use caution when weighing and transferring this reagent.
The procedure and video below describe peptide synthesis on Rink Amide resin. In preparation for your Fmoc deprotection and Fmoc-amino acid coupling reactions, your resin should be swelled in DMF. If your resin is dry, simply add approximately 1 mL of DMF to your SPPS cartridge containing approximately 100 mg of resin and leave it on the shaker for approximately 30 minutes. After draining the DMF, you can proceed with your Fmoc deprotection/Fmoc-amino acid activation cycle as described below.
For the Fmoc Deprotection Step
Add a solution of 20% piperidine in DMF (v/v), approximately 1 mL, to your resin and allow the cartridge to shake for approximately 5 minutes.
After 5 minutes, drain the solution and add a fresh solution of 20% piperidine in DMF (v/v), 1 mL, to the resin. There is no need to wash the resin at this stage. After 15 minutes, drain the solution and wash the resin with DMF, approximately 3 × 1 mL.
Note: To wash the resin, you can simply add solvent from a wash bottle to the cartridge while it is connected to vacuum. For larger scales, you might want to cap and shake the resin in between washes and/or alternate between DMF, MeOH, and CH2Cl2 solvent washes. Methanol will shrink the beads.
For the Fmoc-Amino Acid Activation Step
Dissolve the Fmoc-amino acid, 3 equiv relative to the resin loading, in 1 mL of DMF in a 20 mL vial, followed by addition of HBTU, 3 equiv, and DIEA, 6 equiv. Leave the reaction stirring for approximately 5 minutes, before transferring the activated Fmoc-amino acid solution to the swollen resin. After approximately 1 hour, drain the reagents and wash the resin with DMF, 3 × approximately 1 mL.
This cycle of Fmoc deprotection and Fmoc-amino acid coupling is repeated until your peptide is completed. At the end of the day, you should dry the resin by washing it with CH2Cl2 and let the residual volatile solvent evaporate. If you are trying a difficult coupling and/or these standard reaction conditions are not working, see "Optimizing a difficult coupling" under the Tips & Tricks section.
Greener Solvents
To consider greener solvents for SPPS, see Greening Fmoc/tBu Solid-Phase Peptide Synthesis.
Click to view a coupling video
The Kaiser Test
The Kaiser test is a qualitative colorimetric test to detect free amines. It is frequently employed in solid phase peptide synthesis to monitor the completion of a coupling reaction.1, 2 The test relies on a color change produced by a reaction between ninhydrin and a free amine.
You will need three solutions for the Kaiser test:
Solution A is prepared in two steps. First, prepare a 66% w/v solution of potassium cyanide in ddH2O. Second, perform a 1/50 dilution of the KCN solution in Pyridine, 1 mL of KCN (aq) to 49 mL pyridine.
Solution B is a 5% w/v solution of Ninhydrin in Butanol.
Solution C is a 200% w/v solution of Phenol in Butanol.
The KCN and Phenol accelerate the color change of the Kaiser test.3, 4 To perform the Kaiser test on a resin-bound peptide, simply remove a minimal amount of resin beads with a spatula and place them into a test tube. Add 3 drops of Solutions A, B, and C into the test tube alongside a second test tube with no resin. After adding the reagents, gently heat with a heat gun or in a hot water bath until a color change is observed. Presence of a free amine will correspond to a darker purple-blue color in the test tube with peptide compared to the reference solution.
Click to view a Kaiser Test video
Citations
1. Kaiser, E.; Colescott, R. L.; Bossinger, C. D.; Cook, P. I. Color test for detection of free terminal amino groups in the solid-phase synthesis of peptides. Anal. Biochem. 1970, 34, 595–598.
2. Sarin, V. K.; Kent, S. B. H.; Tam, J. P.; Merrifield, R. B. Quantitative monitoring of solid-phase peptide synthesis by the ninhydrin reaction. Anal. Biochem. 1981, 117, 147–157.
3. Troll, W.; Cannan, R. K. A modified photometric ninhydrin method for the analysis of amino and imino acids. J. Biol. Chem. 1953, 200, 803–811.
4. Moore, S.; Stein, W. H. A modified ninhydrin reagent for the photometric determination of amino acids and related compounds. J. Biol. Chem. 1954, 211, 907–913.
Safety Note: TFA and several scavengers used in cleavage cocktails are highly corrosive, toxic, and reactive. They should only be used with proper precautions and facilities. Thiol additives such as ethanedithiol are highly malodorous and should be handled with care.
Cleavage from the Resin
The cleavage conditions will depend on the resin/linker used and on your specific peptide sequence. A common cleavage cocktail for cleaving a peptide from Rink amide resin, if it does not contain Cys/Met, is 95:2.5:2.5 TFA:H2O:TIPS (v/v/v). It is generally a good idea to perform a test cleavage using a small number of beads before cleaving the entire peptide from the resin, see below. This will allow you to optimize the cleavage conditions if needed.
There are many other scavengers and conditions to try if you notice any undesired side products after LCMS analysis. An excellent quick guide on how to choose a TFA-based cleavage cocktail can be found here. Note that if UV active scavengers are used, such as phenol or thioanisole, these are challenging to remove completely during precipitation steps. They are also likely to be observed in HPLC chromatograms, see Tips and Tricks.
Before any resin cleavage reactions, the resin should be washed with CH2Cl2 or a green solvent equivalent. The cleavage cocktail should be made fresh.
Click to view a Test Cleavage video
Transfer a few beads, such as the tip of a microspatula, to a 1 mL SPPS fritted cartridge containing 200–500 μL of cleavage cocktail.
After approximately 30 minutes, collect the cleavage solution in a 20 mL vial.
Evaporate the TFA cleavage cocktail using either a rotovap, a gentle stream of nitrogen or compressed air in a fume hood, or a suitable alternative evaporator.
Add approximately 1 mL of cold ether to the crude cleaved peptide to precipitate it, decant the ether, and dissolve the residual crude peptide in approximately 200 μL of 1:1 MeCN:H2O for LCMS analysis.
Note: It is best if the cold ether used for peptide precipitation has been in the freezer, −20 °C, for more than 2 hours. Hold on to the ether and 20 mL vial until you have confirmed that your peptide can be detected by LCMS.
Note: The ether precipitation may not work for smaller peptides, which may remain soluble in diethyl ether. Do not discard your ether until you are confident you have recovered all of the crude material!
Click to view a Full Cleavage video
Add 4 mL of your cleavage cocktail to a 20 mL vial and transfer your resin to the vial.
Gently agitate the vial for approximately 2 hours on a shaker.
Filter the solution through a fritted cartridge to remove the resin beads, draining the TFA solution directly into a 50 mL falcon tube containing cold ether, about 30 mL. A white precipitate should start to form.
Centrifuge for 5 minutes, decant the ether, and redissolve the precipitate in MeCN:H2O.
Freeze and lyophilize if you want to obtain a crude weight, or purify the crude by HPLC directly.
Large, hydrophobic, or aggregation-prone peptides can present particular challenges when attempting to dissolve them for purification. Sometimes, a simple mixture of water/acetonitrile will not keep your peptide soluble for long enough to enable purification, as described below. If your peptide does not easily dissolve, or dissolves and later aggregates to form a gel, there are several tips and tricks that you can try out — see the Tips & Tricks section.
Purifying with an HPLC
The most common method of purification for peptides is using a preparative RP-HPLC with a C18 column and a gradient of MeCN in water, where both mobile phases contain 0.1% of either formic acid, FA, or trifluoroacetic acid, TFA. The specific gradient to use during your purification should be previously optimized on an analytical HPLC or LCMS.
You should look for methods that allow the best separation between your peptide and undesired side products, while eluting your desired peptide about half-way through your gradient. If you don't know where to start, you can try injecting a small amount of your peptide on the LCMS or analytical HPLC with a gradient of 20–80% MeCN, 0.1% TFA, in water, 0.1% TFA.
If your peptide elutes too early, try a 5–40% gradient; if your peptide elutes too late, try a 40–90% gradient. Some very hydrophilic peptides, such as Octa-Arg, might not efficiently adhere to the stationary phase and will elute with the solvent front — special care must be taken in these cases. Alternatively, some hydrophobic peptides adhere very strongly to the stationary phase, which also requires special considerations, see Tips & Tricks.
Once an acceptable gradient has been identified, you can purify your peptide on the preparative HPLC using this gradient. When injecting your peptide on the prep HPLC, make sure to dissolve your crude peptide in a minimum volume of your starting conditions, for example, approximately 50–100 mg of crude peptide in 2–3 mL of MeCN/H2O, and filter your sample using 17 mm Nylon syringe filters.
Analyze the fractions by LCMS or analytical HPLC, combine all fractions that contain your product in similar purity, freeze and lyophilize. If you are using 0.1% TFA in your eluent, you might want to form the HCl salt instead of the TFA salt for some applications. To do so, you can redissolve your purified peptides in 100 mM HCl, freeze the solution and lyophilize again. Repeat this step twice, for a total of three times.
If your crude peptide sample is relatively clean and you have large amounts to purify, you could also consider using reverse-phase flash chromatography for your purifications. See here for an example.
Optimizing a Difficult Coupling
If you observed very low conversions to your desired product with significant amounts of unreacted starting material, we recommend trying to optimize the reaction by screening a variety of different coupling reagents. Yields may also be improved through repeated coupling reactions, double or triple coupling, or prolonged coupling reactions, overnight, for example.
When optimizing your reaction, please be mindful that activated amino acids can be prone to racemization. Check for literature precedence on specific coupling reagents before attempting to heat your reaction during your optimization, or see "How to check for Epimerization" under Troubleshooting, below, to do this yourself.
If you don't know where to start, the following coupling reagents could be a good starting point: COMU, triphosgene, use caution, Ghosez' reagent, EEDQ at 60 °C. These have shown utility in the synthesis of azapeptides, N-amino peptides, and oligo(N-substituted alanines) for coupling to the unnatural amino acids.
For more information on coupling reagents, see: Peptide Coupling Reagents, More than a Letter Soup
If you are working with difficult peptide sequences that may be prone to aggregation, a different optimization might be necessary. See: The road to the synthesis of "difficult peptides."
Heating a Reaction on Solid Phase
Heating a reaction on solid phase can be accomplished a few different ways. Simply placing an SPPS cartridge or microwave vial in an oil bath may work to an extent, but will not allow for agitation of the resin during the reaction. For alternative, likely more efficient procedures, consider the following options:
Placing your SPPS cartridge in a heated sonicator. Some models allow you to heat between 30–80 °C, other models just have an "on/off" switch for heating and will reach approximately 60 °C. If you are near or above the boiling point of your solvent, use microwave vials instead of SPPS cartridges to prevent the caps from popping off your cartridge due to pressure buildup.
Using jacketed peptide vessels, which are available on Chemglass. When connected to a heated water bath circulator, these allow you to circulate warm water around a fritted glass vessel that contains your resin. The resin can undergo mixing by bubbling of nitrogen.
Optimizing Your Cleavage Cocktail
You might notice some undesired side reactions during resin cleavage, which can sometimes be prevented by adjusting your cleavage cocktail composition. An excellent quick guide on how to choose a TFA-based cleavage cocktail can be found here.
Dissolving Tricky Peptides
As "tricky peptides" we consider insoluble, hydrophobic, and aggregation-prone peptides after ether precipitation for purification.
If you observe an immiscible phase/oil drop appearance when attempting to dissolve crude peptide, it may result from residual organic solvent, diethyl ether, used for precipitation. Freezing and lyophilizing can help remove residual solvent. We've often observed that powders, observed upon lyophilization, are more readily produced after ether precipitation.
Some peptides require long durations of intense agitation for solvation. Consider exposing peptides immersed in water/MeCN mixtures to sonication at an elevated temperature, up to 50 °C for up to 30 minutes. Ultrasonic water bath incubators work well for this purpose.
Some peptides that fail to dissolve well in standard solvent mixtures, water or 50/50 water/acetonitrile, will dissolve in pure water-miscible organic solvents, DMSO/DMF. We have found frequent success in lyophilizing insoluble crude peptides by first suspending crude peptide in a water/acetonitrile mixture followed by dropwise addition of DMSO until the peptide dissolves. Lyophilization of the resulting solution provides a white powder. If the addition of DMSO/DMF is not acceptable, you can also try resuspending crude peptides first in pure acetonitrile followed by addition of water.
Peptides which are particularly insoluble may not be amenable to solubilization using any of the methods above. In such cases, you can first dissolve in a small volume of trifluoroacetic acid followed by dilution with MeCN. Such aggressive solvents can prevent the peptide from adhering to reverse phase stationary phase upon injection onto HPLC. Such preparations should be tested on analytical scale to ensure peptide adheres prior to large scale injections.
Avoiding Complications from UV Active Scavengers in Cleavage Cocktails
Additives to cleavage cocktails such as phenol and thioanisole are difficult to remove completely with ether precipitation steps and often show large peaks in HPLC chromatograms. These contaminants can be particularly problematic if they co-elute with desired products. We have found that redesigning the acetonitrile gradient in HPLC, making a steeper or more shallow ascent in acetonitrile concentration, can often provide resolution between scavenger peaks and peptide peaks — even if the two overlap using other gradients.
Purifying Hydrophobic Peptides on Reverse-Phase HPLC
Very hydrophobic peptides have been known to irreversibly adhere to reverse-phase columns. Certain tricks can be used to reduce adherence of such hydrophobic peptides. Columns can be heated, to reduce adherence and provide sharper HPLC peaks, using water jackets. Water and acetonitrile HPLC solvents can be supplemented with organic cosolvents, such as isopropanol, although this can increase solvent backpressure due to viscosity changes.
Common Impurities
A large peak after injection can be due to residual DMF if the resin was not washed with CH2Cl2 before cleavage.
A large hydrophobic peak near the end of your gradient might be associated with trityl protecting groups, trityl alcohol. Repeat the ether precipitation step to remove such byproducts.
Peaks corresponding to phenol and thioanisole can be observed when using cleavage cocktails with these additives, see above.
Aspartic acid residues can undergo aspartimide formation, leading to epimerization and other undesired side reactions. Aspartamide formation causes a minus 16 mass. Try changing the protecting group, for example, using Fmoc-Asp(OMpe)-OH instead of Fmoc-Asp(OtBu)-OH during synthesis.
M + 44 can correspond to a CO2 adduct, sometimes seen after cleavage and deprotection of a sequence containing a Trp(Boc) residue. The adduct will disappear over time on its own; if you analyze the same sample by LCMS again after 24 hours, you will see only your desired peak/mass.
Trp indole side chain can be reduced by TES when added as a scavenger. If this is observed, use TIPS instead of TES.
Methionine residues can undergo oxidation to methionine sulfoxide (M + 16). Try cleaving your peptide under an N2 atmosphere. You can also try substituting methionine for norleucine, Nle.
If you observe a peak with a higher mass than your expected peptide, check for incomplete side chain deprotections. Some protecting groups, for example Pbf on Arg, might require longer reaction times for complete deprotection. Alternatively, reactive cations formed during side chain deprotection might react with nucleophilic sites on your peptides to form new covalent bonds. If this is the case, change your cleavage cocktail to include better scavengers.
Peptides synthesized on Wang resin with a C-terminal Cys are prone to elimination reactions, to form dehydroalanine (−36), an adduct resulting from the reaction of dehydroalanine with piperidine (+49), or epimerization at the C-terminal position.
Low Yields
Verify your resin loading using the Fmoc loading test, where you calculate the amount of liberated dibenzofulvene-piperidine adduct by UV spectroscopy after an Fmoc deprotection cycle.
If you are using chlorotrityl resin, your resin can be regenerated following established procedures.
If you are doing the ether precipitation step after resin cleavage, check your ether supernatant in case your peptide is partially soluble in Et2O.
Further rinse your cleaved resin with your TFA cleavage cocktail and evaporate to see if more peptide can be recovered.
If you identify any deletion side products, re-synthesize your peptide and optimize the problematic coupling step.
Peptides with nucleophilic side chains, especially at the C-terminus, for example Trp and Met, can re-attach to the resin if improper scavengers are used during TFA-promoted resin cleavage. Try using a cleavage cocktail that contains ethanedithiol, EDT.
How to Check for Epimerization
A simple way to check for epimerization during an Fmoc-amino acid coupling reaction is to synthesize two tripeptides: L-Ala-Xaa-Phe and D-Ala-Xaa-Phe, where you are optimizing the coupling of L- or D-Ala onto resin-bound H2N-Xaa-Phe.
Couple Fmoc-L-Ala-OH and Fmoc-D-Ala-OH separately to resin-bound H2N-Xaa-Phe using the reaction conditions under study.
Following synthesis and resin cleavage of the two resulting diastereomeric peptides, use a small part of the materials synthesized to make a solution containing a 1:1 mixture of both peptides in MeCN/H2O. You only need enough material to make approximately 1 mg/mL solutions for LCMS or HPLC analysis.
Identify a suitable gradient capable of separating your 1:1 mixture of diastereoisomers by analytical HPLC.
Using these HPLC conditions, measure the amount of diastereoisomer/s present in each of the "pure" samples and calculate the diastereomeric peak ratios. You should be getting the same ratio for both L-Ala-Xaa-Phe and D-Ala-Xaa-Phe, although the major diastereoisomer will be different.
Common Mistakes
Not performing a test cleavage with a small amount of resin before doing the full cleavage. This will give you the opportunity to optimize the cleavage conditions if needed.
Not washing the resin enough in between deprotections and couplings.
Not washing the resin with DCM before TFA cleavage. This can result in a large DMF peak in your LC trace.
Not removing the top cap before the bottom cap when using disposable SPPS cartridges. This is important so you don't spill test cleavage all over your bench.
Not Fmoc deprotecting your resin before use.
Not properly noting resin loading prior to calculations.
Using amino acid building blocks with inappropriate protecting group functionalization. Be sure that any side chain protecting groups on your Fmoc-amino acid building blocks can be removed under the cleavage conditions used.
Circular Dichroism Spectroscopy
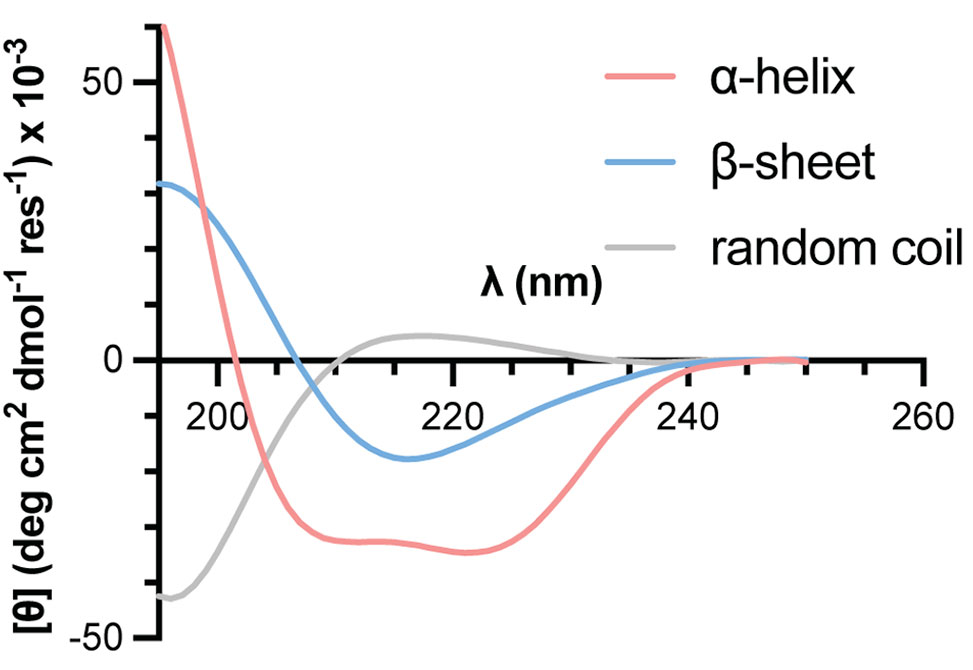
Circular Dichroism, CD, spectroscopy is a common analytical method applied for the characterization of folding behavior in peptides, proteins, and related biomacromolecules. A CD experiment measures the difference in absorption of left- vs. right-handed circularly polarized light as a function of wavelength. For peptides and proteins, CD spectral characteristics of the backbone amide chromophores in the far UV region, approximately 190–260 nm, show characteristic features that vary with secondary structure content.
CD spectroscopy illustration showing differential absorption of circularly polarized light
Given access to suitable instrumentation, measurement of a CD spectrum is a relatively straightforward method to give qualitative insights into secondary structure preferences of a synthesized peptide using minimal material. The protocol below gives an overview of steps to perform a basic CD measurement.
Protocol
Prepare a solution of peptide in buffered water. Employ the minimal concentration of buffer and salt needed to maintain the desired pH and also support folding of the peptide under study. A reasonable first attempt for a measurement on a new system would be a sample composition of 100 μM peptide in 10 mM phosphate buffer at pH 7.
Prepare a corresponding matched buffer blank solution identical to the above but without peptide.
Using a micropipette, transfer the buffer blank solution to a 1 mm path length quartz cuvette.
Acquire a CD spectrum of the blank in the range of 195–260 nm, see relevant details from documentation for the CD instrument used.
Rinse the cuvette with water, then methanol, then dry under a gentle stream of dry nitrogen.
Using a micropipette, transfer the peptide solution to the 1 mm cuvette and acquire a CD spectrum of the peptide using the same instrument settings as above.
Subtract the buffer CD spectrum from the peptide CD spectrum.
Convert the resulting CD values at each wavelength, typically output by the instrument in mdeg, to mean residue molar ellipticity according to the following equation.
![Mean residue molar ellipticity formula: [θ] = θ / (10 × l × c × r)](https://aps2026-production.nyc3.digitaloceanspaces.com/media/primer_images/cds_formula.jpg)
Mean residue molar ellipticity formula: [θ] = θ / (10 × l × c × r)
Additional Reading
Greenfield, N. (2006). Using circular dichroism spectra to estimate protein secondary structure. Nature Protocols, 1, 2876–2890. https://doi.org/10.1038/nprot.2006.202, provides a leading reference to further reading on CD theory, experimental design, and data analysis.
NMR Spectroscopy for Peptide Structure Determination
NMR spectroscopy is one of the most powerful methods to explore the structure and dynamics of peptides in solution. The three-dimensional solution structures of peptides, and in particular the number of intramolecular hydrogen bonds, influence several properties, such as solubility and membrane permeability.
NMR Spectroscopy provides information of peptide sequence and characterization, the intramolecular hydrogen bonds within the peptide structure, as well as the number of conformations present in different solvent environments. NMR-based structure determination of peptides comprises several steps including NMR data acquisition, determination of conformational constraints, and calculation of ensembles of 3D solution structures.
Sample Preparation
Typical 1D and 2D NMR spectra analysis of peptides requires 1–2 mg of compound for a good quality of NMR data. The concentration of peptide has effect on the quality of spectra, quality of peaks, shimming of the system, et cetera. Using proper deuterated solvent with the required amount depending on the NMR system is also another parameter to get a high quality of NMR spectra.
Resonance Assignments and Structural Restraints
Sequence-specific NMR resonance assignments to each amino acid in the peptide sequence need to be obtained before structure determination can be attempted. For a small non-labeled peptide, the primary 2D 1H-NMR experiments used for resonance assignments of peptides include correlation spectroscopy, COSY, or double-quantum filtered correlation spectroscopy, DQF-COSY, total correlation spectroscopy, TOCSY, and nuclear Overhauser effect spectroscopy, NOESY/Rotating-frame Nuclear Overhauser Effect spectroscopy, ROESY.
1D Proton NMR:
1D proton NMR of peptides gives a quick information on number of conformations of peptide in solution, aggregation problem et cetera. Additionally, 3JHN-Hα scalar couplings that are used to derive backbone torsional restraints used in the structure calculations can be extracted from amide proton region of 1D proton NMR if the amide proton peaks are well-separated and sharp enough. J-couplings provide another source of information for peptide structure determination. 3JHN-Hα scalar couplings derived from either 1D proton or 2D COSY spectra are converted to backbone dihedral angle restraints using the Karplus equation below.
3JHN-Hα = 6.4 cos2Θ − 1.4 cosΘ + 1.9
There exists a relationship between the 3JHN-Hα couplings and secondary structure of peptides. Values of 3JHN-Hα less than 4.5 Hz are indicative of α-helical structure, whereas values greater than 8.5 Hz are found for residues in β-strands. 3JHN-Hα values in the range 5–8 Hz potentially result from averaging over multiple peptide conformations present in the solution, and as such should only be used when employing time-averaged or ensemble-averaged restraints in structure calculations.
2D TOCSY — Total Correlation Spectroscopy:
TOCSY spectra provide through-bond intra-residue correlations in the same spin systems via spin-spin couplings and it give characteristic peak patterns for identifying amino acid type that are called fingerprints of amino acids. Since protons from different amino acids belong to different spin system, it is one of the major experiments to identify each residue in the peptide structure.
2D COSY — Correlated Spectroscopy:
COSY spectra give information on proton-proton correlations due to through-bond couplings. Similar to TOCSY, position of cross peaks in COSY are also characteristic for each amino acid. It gives primarily information of the connectivity in each amino acid. Additionally, cross-peaks of 2D COSY spectra are used to determine 3JHN-Hα scalar couplings to convert to backbone dihedral angle restraints using the Karplus equation above.
2D NOESY and ROESY:
Nuclear Overhauser Effect Spectroscopy or Rotating-frame Nuclear Overhauser Effect spectroscopy. Cross-peaks of NOESY and ROESY spectra provide information that can be used to locate the spin systems within the peptide sequence via through-space, sequential NOE/ROE connectivity between adjacent residues. The intensities of cross-peak volumes depend on the distance between protons; thus, the distance restraints are calculated from the cross-peak volumes observed in NOESY or ROESY spectra. The NOE/ROE cross-peak volumes can be converted into interproton distances based on the 1/r6 dependence of the volume on the internuclear distance.
The NOE signals depend on the interproton distances, the observation frequency, ω, and the rotational correlation time, τc, and hence the size of the molecule. The NOE signal changes sign at ωτc ≈ 1.12, which leads to little or no NOE signal being observed for medium-sized compounds, MW 500–2,000 Da, which is clearly an impediment for the extraction of distance information from NOESY spectra of peptides in this size range, see Figure 1. This issue can be overcome by using rotating-frame nuclear Overhauser effect spectroscopy, ROESY, which gives negative cross peaks for all values of ωτc. A disadvantage of using ROESY spectra, however, is the presence of TOCSY cross peaks due to J couplings, which can seriously complicate the extraction of distance restraints. To overcome this drawback, the Efficient Adiabatic Symmetrized ROESY, EASY-ROESY, pulse sequence may be used to suppress TOCSY spectral artifacts.
The sequential order of NMR spin systems in a peptide sequence is determined by NOE/ROE sequential walking through the amide proton region of the NOESY or ROESY spectrum. Sequential walking is interrupted by the presence of proline or N-methyl amino acids in the peptide sequence, which lack backbone HN protons. The presence of proline, proline analogues, or N-methyl amino acids further complicates spectral analysis due to cis/trans peptide bond isomerization, which frequently occurs in the NMR slow exchange regime resulting in separate signals corresponding to the cis and trans isomers in the spectra of the peptides. Analysis of the NOE signals can be used to assign the peptide bond isomerization — a strong NOE signal between the HN of residue i and the Hα of residue i+1 indicates a cis-peptide bond.
Figure 1. NOEs from NOESY spectra are positive for small molecules, MW < 600, goes through zero for medium-sized molecules, 700 < MW < 1200, and becomes negative for large molecules, MW > 1200. On the other hand, ROESY is always positive, thus, it is preferred for medium-size molecules.
3D Solution Structure Determination of Peptides
NMR data, including NOE distance restraints and J-couplings, can be used to calculate the 3D solution structures of peptides by using software packages developed for NMR-based protein structure determination, such as CYANA, CNS, or Xplor-NIH, or, alternatively, the NAMFIS, NMR Analysis of Molecular Flexibility in Solution, method.
The protein structure determination algorithms typically use torsion-angle molecular dynamics, MD, where the only degrees of freedom are rotations about covalent bonds — the NMR-derived restraints are added as additional force field terms. The standard simulated annealing protocol in, for instance, CYANA, initiates from a conformation in which all torsion angles are treated as independent, uniformly distributed random variables and comprises five stages.
These include initial minimization to reduce high-energy interactions that could disturb the torsion angle dynamics algorithm, a high-temperature phase, slow cooling to a low temperature, a low-temperature phase for checking steric overlaps, and a final energy minimization phase. Multiple calculation cycles yield a number of low-energy conformers that satisfy the experimental NMR-derived restraints. The quality of the calculated structures is evaluated based on the number and magnitude of violations from the experimental restraints, distribution of the backbone dihedral angles in the Ramachandran plot, and residue-specific root mean square deviations, RMSDs, for backbone and heavy atoms.
One challenge frequently encountered when using programs such as CYANA for calculating peptide structures is the incorporation of non-proteinogenic amino acids and cyclization chemistries. In order to use CYANA for such peptides, the algorithm has been extended through the use of the CYLIB program, which automatically generates the residue topology files required for the torsion-angle molecular dynamics algorithm used within CYANA for the structure calculations. CYLIB typically uses the structure database in the PDB Chemical Component Dictionary to generate new topology files in the CYANA residue library format. However, topology files for some non-natural amino acids still need to be created using other methods, such as quantum mechanical modeling methods, such as DFT calculations, and then converted into the CYANA format using the CYLIB converter.
NAMFIS is an alternate method for solution structure elucidation of peptides, and is particularly useful for the analysis of flexible peptides. The NAMFIS protocol essentially comprises two steps. The initial step entails generation of a "complete" set of possible molecular conformations that includes potential members of the solution ensemble. The averaged NMR-derived NOE distances and J-couplings are then deconvoluted by varying the molar fractions of the computed theoretical ensemble until the best fit to the experimental NMR data is obtained.
The result is an ensemble of all conformations present in solution, together with their probabilities, which provides a better understanding of the solution state than is possible through average structure calculations. The overall quality of the structural ensembles determined by the NAMFIS method depends on the diversity of the conformational sampling pool employed, along with the NOE-distances and J-couplings extracted from the NMR data. A significant challenge with using the NAMFIS method is, thus, the problem of efficient and complete conformational sampling of large flexible compounds.
Analysis of Intramolecular Hydrogen Bonds
Intramolecular hydrogen bonds, IMHBs, in peptide structures can significantly impact peptide properties, such as solubility and membrane permeability. While exposure of the amide bonds in the peptide backbone to solvent is associated with poor membrane permeability, shielding of backbone amide protons through IMHBs can significantly enhance passive cell permeability.
Amide proton temperature coefficients, ΔδHN/ΔT, are derived by correlating 1H-NMR chemical shifts of backbone amide protons with temperature. The chemical shifts of the amide protons depend on the inverse third power of the distance between the amide proton and its hydrogen-bond acceptor. Generally, amide protons with temperature coefficients more negative than −4.6 ppb/K can be classified as "solvent-exposed," and more positive than −4.6 ppb/K can be classified as "shielded" due either to strong IMHBs or steric shielding from solvent interactions by, for example, neighboring aromatic rings. If 1H NMR analysis for the chemical shift temperature dependence fails due to extensive signal overlaps, 2D-TOCSY spectra can be used to determine the temperature coefficients.
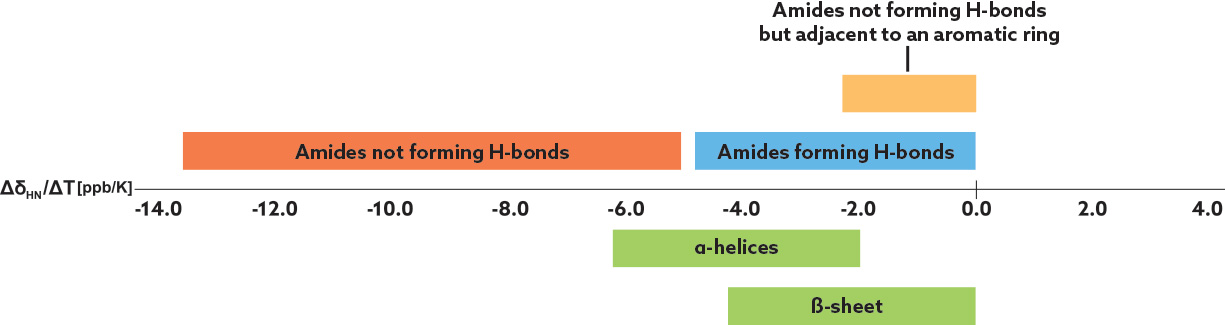
Figure 2: Temperature coefficient analysis of amide protons by NMR
Conformational Analysis of Peptides by NMR Spectroscopy
Conformational analysis of peptides is usually performed in either polar solvents mimicking the aqueous environment, such as dimethyl sulfoxide, DMSO, acetonitrile, ACN, methanol, or pyridine, or in nonpolar solvents mimicking the membrane interior, such as chloroform, CDCl3, tetrahydrofuran, THF, or dichloromethane, DCM, depending on the solubility of the peptide. DMSO or ACN/water mixtures are most commonly used for high-dielectric conformational analysis mimicking the aqueous environment. To understand the conformational switch of peptides from an aqueous to a membrane environment, chloroform is most commonly used as the NMR solvent since its dielectric constant, ε = 4.8, is most similar to that of a cell membrane, ε = 3.28.
More Readings
Cavanagh, J., Fairbrother, W. J., Palmer, A. G., Rance, M., & Skelton, N. (2007). Protein NMR spectroscopy: Principles and practice. Elsevier: Amsterdam.
Thiele, C. M., Petzold, K., & Schleucher, J. (2009). EASY ROESY: Reliable Cross-Peak Integration in Adiabatic Symmetrized ROESY. Chemistry — A European Journal, 15(3), 585–588. doi.org/10.1002/chem.200802341
Farley, K. A., Che, Y., Navarro-Vazquez, A., Limberakis, C., Anderson, D., Yan, J. L., Shapiro, M., Shanmugasundaram, V., & Gil, R. R. (2019). Cyclic Peptide Design Guided by Residual Dipolar Couplings, J-Couplings, and Intramolecular Hydrogen Bond Analysis. Journal of Organic Chemistry, 84(8), 4803–4813. doi.org/10.1021/acs.joc.9b00352
Wishart, D. S., Sykes, B. D., & Richards, F. M. (1992). The Chemical Shift Index: A Fast and Simple Method for the Assignment of Protein Secondary Structure through NMR Spectroscopy. Biochemistry, 31(6), 1647–1651. doi.org/10.1021/bi00121a010
Guntert, P. (2009). Automated structure determination from NMR spectra. European Biophysics Journal, 38(2), 129–143. doi.org/10.1007/s00249-008-0334-1
Cicero, D. O., Barbato, G., & Bazzo, R. (1995). NMR Analysis of Molecular Flexibility in Solution — A New Method for the Study of Complex Distributions of Rapidly Exchanging Conformations — Application to a 13-Residue Peptide with an 8-Residue Loop. Journal of the American Chemical Society, 117(3), 1027–1033. doi.org/10.1021/ja00108a021
X-Ray Crystallography
X-ray crystallography is one of the most powerful techniques for determining the atomic-resolution structure of peptides. By analyzing the diffraction pattern of X-rays passing through a crystallized peptide, researchers can infer the three-dimensional structure of the peptide at atomic detail. This method is critical for understanding the conformation of peptides, their interactions with other biomolecules, and their functional roles in biological systems.
Principles of X-ray Crystallography
The core principle of X-ray crystallography lies in the diffraction of X-rays by the electron cloud of atoms within a crystal. When a peptide is crystallized and exposed to X-ray radiation, the scattered rays form a diffraction pattern that encodes information about the arrangement of atoms in the crystal lattice. Using mathematical methods, specifically Fourier transforms, this diffraction pattern is converted into an electron density map, which serves as the basis for building an atomic model of the peptide structure.
Key parameters include the unit cell dimensions and symmetry, which define the repeating unit of the crystal, and the space group, which describes the symmetry operations of the crystal lattice. Solving a crystal structure requires both the amplitudes of the diffracted X-rays (measurable directly) and their phases (not directly measurable), a challenge known as the phase problem. Common solutions include molecular replacement, where a known similar structure is used as a starting model, and single-wavelength anomalous diffraction, SAD, phasing. Heavy atoms can be introduced by soaking peptide crystals in heavy-atom solutions or by synthesizing peptide variants with a covalently attached heavy atom.
Protocol
Contribution from Drs. Adam Kreutzer and James Nowick, UC Irvine.6, 7
1. Screening for Peptide Crystallization.
The hanging-drop vapor-diffusion method is a common technique for the crystallization of peptides. In this method, a droplet containing equal volumes of the peptide solution and crystallization solution, for example, 0.5–1.0 μL each, is mixed, inverted, and sealed over a well containing the crystallization solution. To screen a peptide for crystallization, prepare 96-well screening plates with crystallization solutions from Hampton Research screens, such as PEG/Ion, Index, and Crystal Screen. Dissolve the peptide in deionized water at a concentration ranging from 5 to 15 mg/mL. The optimal peptide concentration for crystallization is typically determined empirically. Crystallization droplets can be prepared either manually using a pipette or with an automated pipetting robot, such as the SPT Labtech Mosquito, which can prepare smaller droplets with volumes as low as 100 nL. Seal the plates securely to prevent evaporation, then examine the droplets under a stereo microscope after 1 to 24 hours to identify potential crystals. Recheck the plates every 24 to 48 hours, and optimize the conditions for droplets that yield crystals as needed.
Hanging-drop vapor-diffusion method for peptide crystallization
2. Optimizing Peptide Crystallization.
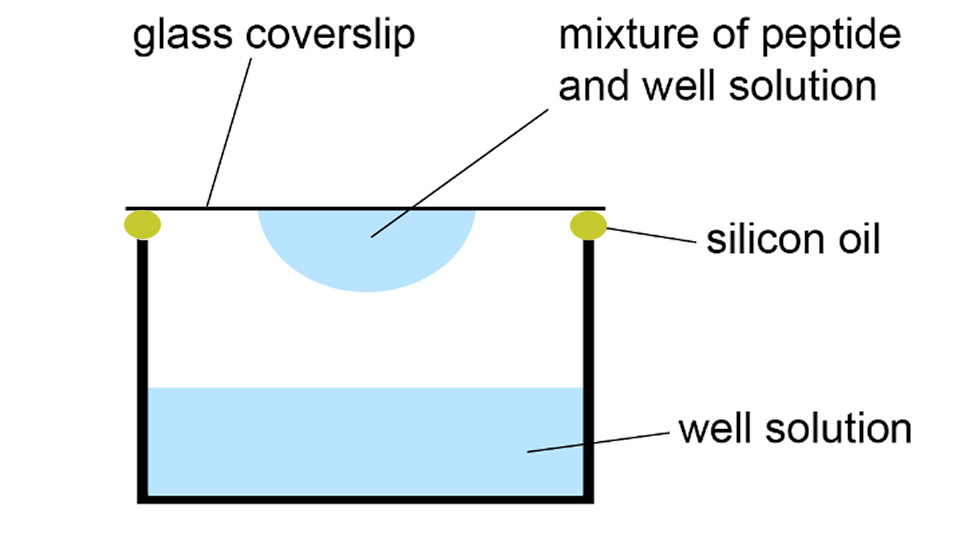
To optimize peptide crystallization conditions, prepare a peptide solution in water and concentrated solutions of relevant buffers, salts, or cryoprotectants, filtering them through a 0.22 μm filter. Using a 24-well plate with siliconized rims, create a matrix by systematically varying two properties of the crystallization condition, such as buffer pH and cryoprotectant concentration. Pipette the appropriate volumes into each well to achieve a final volume of 1 mL per well, adjusting with water as needed. Prepare three drops on a siliconized cover slide by mixing the peptide solution and well solution in 1:1, 2:1, and 1:2 ratios. Invert the slide onto the 24-well plate, ensuring a firm seal with silicone grease. Examine the droplets under a stereo microscope after 1–24 hours and reexamine every 24–48 hours to identify crystals. Harvest crystals of suitable quality for X-ray diffraction studies and freeze in liquid nitrogen.
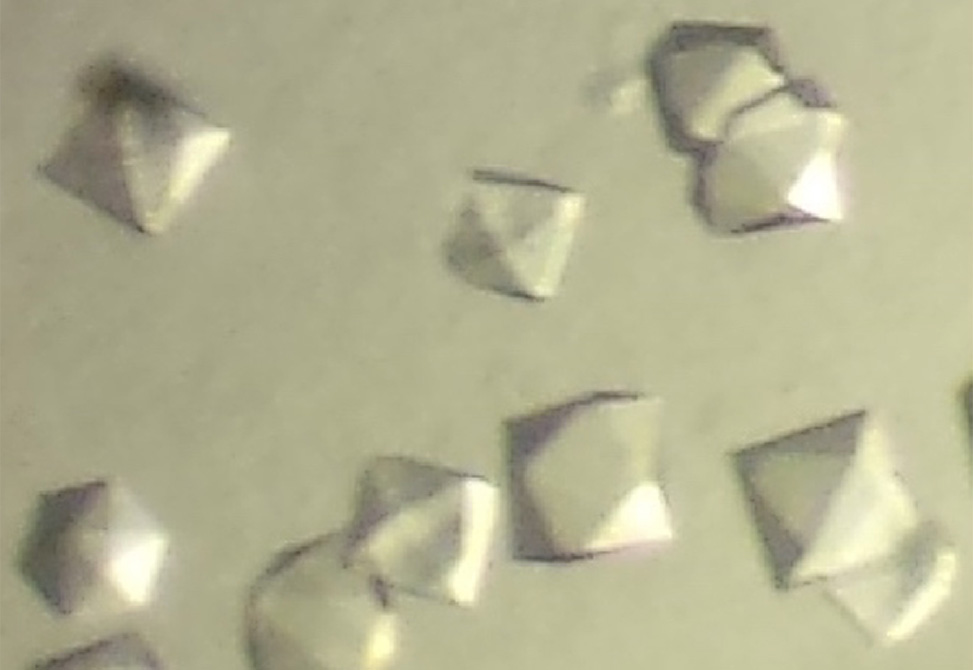
Optimized peptide crystals
3. Preparing Peptide Crystals for X-ray Diffraction.
To diffract peptide crystals, select an appropriately sized CryoLoop to scoop up the peptide crystal. Use a razor blade to carefully lift the glass coverslip containing the crystal drop, placing it drop-side-up on the tray lid for better focus. If cryoprotection is required, mix 1 μL of cryoprotectant with 1 μL of well-solution in a drop next to the drop you are harvesting the crystal from. Scoop the crystal with the CryoLoop, and if needed, dip it in the cryoprotectant, swirling gently to remove excess aqueous solution. Finally, mount the crystal on a goniometer, center it relative to the X-ray beam, and maintain it in a liquid nitrogen stream for diffraction. Diffraction data can be collected using in-house X-ray diffractometers with copper anodes that produce 1.54 Å X-rays or at synchrotron sources, which typically produce higher-resolution 1.0 Å X-rays.
4. Collecting X-ray Diffraction Data.
Initial diffraction images are taken at different angles to assess diffraction quality; high-quality crystals produce well-defined, round spots and diffract to high resolution. Typically, a few images are collected to index the crystal, determining its cell dimensions, angles, and potential space group. For crystals with high-quality diffraction, a complete data set is collected by rotating the crystal in 0.5° or 1° increments and capturing diffraction images through a full 360° rotation.
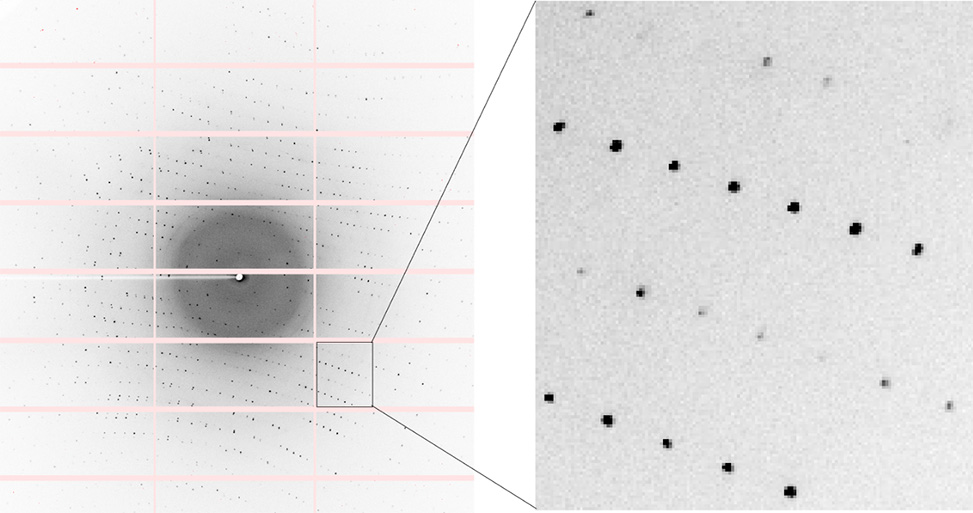
Diffraction image of peptide crystal acquired on synchrotron beamline 5.0.2 at the Advanced Light Source
5. Processing Peptide Crystal Diffraction Data.
After collecting a crystal diffraction data set, the data is processed in several steps: indexing, integration, scaling, and merging into a single reflection file. XDS is commonly used for indexing and integration, and Pointless and Aimless are used to determine the most probable space group, merge data, and assess data quality. Additional graphical user interface software options, such as iMosflm, HKL2000, and d*TREK, are also available for data processing.
6. Solving Peptide Crystal Structures.
The process of solving peptide crystal structures involves assessing data quality, determining X-ray crystallographic phases, generating an electron density map, and building a structural model. These steps can be performed using widely available software suites such as CCP4 or Phenix, which provides tools for data processing, phase determination, electron density map generation, and model building. Many crystallography programs within Phenix include detailed user guides, making them accessible to a broad audience.
To solve X-ray crystallographic phases for peptide crystals, the most common initial approach is molecular replacement, provided a suitable search model exists. If molecular replacement is unsuccessful, alternative methods such as incorporating heavy atoms into the crystal lattice and then using single-wavelength anomalous diffraction, SAD, phasing can be employed. Heavy atoms like iodide or bromide may be introduced by soaking crystals in solutions containing salts like potassium iodide or sodium bromide. Additionally, if the peptide contains disulfide cross-links or methionine residues, sulfur single-wavelength anomalous diffraction, S-SAD, phasing can be attempted.
In cases where soaking is insufficient or inappropriate, heavy atoms can be directly incorporated into the peptide during synthesis by substituting a suitable residue with one containing a heavy atom, such as phenylalanine to para-iodophenylalanine, leucine to (2-bromoallyl)glycine, or methionine to selenomethionine. These methods provide flexibility in solving challenging structures, particularly for large or complex peptides.
7. Model Building and Refinement.
Once an electron density map and preliminary structural model are generated, they are loaded into a macromolecular model-building program such as Coot. Coot is used to build, edit, and manipulate models to fit the electron density map. During this process, residues, side chains, and solvent molecules are manually adjusted to fit the observed density.
After initial model building, the structure undergoes iterative cycles of refinement and manual adjustment to improve the model's agreement with experimental data. Refinement is typically performed using tools like phenix.refine from the Phenix software suite. This step optimizes the model by adjusting atomic positions, B-factors, and occupancies to minimize the crystallographic R-factors, Rwork and Rfree, which measure the agreement between the model and the observed diffraction data.
During refinement, validation tools are employed to ensure that the model adheres to stereochemical restraints, such as correct bond angles and lengths, and that no unusual structural features are present unless supported by the data. For peptides, particular attention is given to ensuring accurate placement of side chains and loops, which are often more flexible than the peptide backbone and can result in poorly defined electron density.
Additional rounds of refinement may involve introducing water molecules, ligands, or ions into the model, guided by unmodeled electron density. For peptides with complex geometries or non-standard residues, custom restraints may need to be applied during refinement. This iterative process continues until the model achieves the highest possible accuracy and reliably represents the peptide's crystal structure. The structure is then deposited in the RCSB Protein Databank.
Citations
1. Drenth, J. (2007). Principles of protein X-ray crystallography (pp. 45–67). Springer.
2. Cherezov, V., et al. (2007). Crystallization of membrane proteins in lipidic mesophases: A mechanistic perspective. Science, 317(5839), 377–381. doi.org/10.1126/science.1139266
3. Rupp, B. (2010). Biomolecular crystallography: Principles, practice, and application to structural biology (pp. 423–460). Garland Science.
4. Müller, A., Broghammer, J., & Börner, A. (2015). X-ray crystallography in drug design: Peptide-receptor interaction studies. Journal of Structural Biology, 191(2), 236–245. doi.org/10.1016/j.jsb.2015.07.010
5. Chapman, H. N., et al. (2011). Femtosecond X-ray protein nanocrystallography. Nature, 470(7332), 73–77. doi.org/10.1038/nature09750
6. Spencer, R. K., & Nowick, J. S. (2015). A newcomer's guide to peptide crystallography. Israel Journal of Chemistry, 55, 698–710.
7. Guaglianone, G., Kreutzer, A. G., & Nowick, J. S. (2021). In Petersson, E. J. (Ed.), Methods in Enzymology (Vol. 656, pp. 123–168). Academic Press.
Immobilized Artificial Membrane Chromatography — IAM
Immobilized Artificial Membrane, IAM, chromatography is a method to create an immobilized phospholipid environment of a cell membrane on HPLC grade silica stationary phase. The IAM stationary phases are developed by covalently attaching the phospholipids to an amino-propyl silica stationary phase. The commercially available IAM HPLC column contains phosphatidyl choline on silica particles.
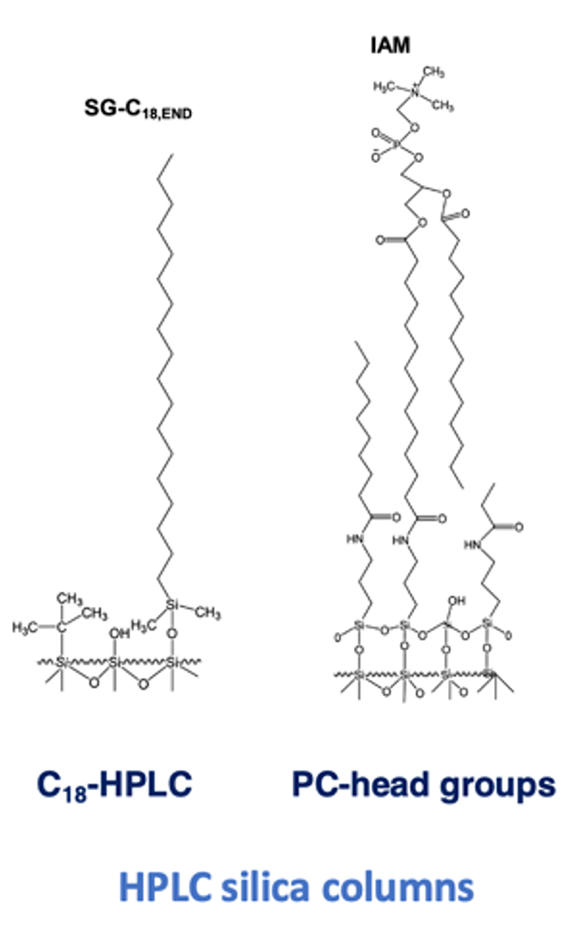
IAM silica column structure showing immobilized phosphatidylcholine on silica particles
Estimation of drug permeation and drug-membrane interaction by IAM chromatography involves the determination of retention factor of compounds on IAM stationary phase. A gradient method with acetonitrile on IAM HPLC column provides a chromatographic hydrophobicity index, CHI IAM, where the gradient retention times are calibrated with data obtained from isocratic measurements of reference compounds, see Table 1. CHI IAM values are then converted to the lipophilicity scale, log k IAM, using the equation that is obtained from plotting the isocratic log k values of reference compounds against CHI IAM values.
log k (IAM) = 0.0046 × CHI (IAM) + 0.42
The log k IAM is referred to as the partition coefficient of a compound between an aqueous phase and an immobilized artificial membrane. This coefficient can be used to predict the compound's potential passive diffusion.
Method
| Column | IAM column (150 × 4.6 mm) |
| Mobile phase A | 50 mM ammonium acetate pH 7.4 |
| Mobile phase B | Acetonitrile |
| Flow rate | 2.0 mL/min |
| Gradient | 0 to 2.5 min: 0 to 70% solvent B 2.5 to 3.0 min: 70% solvent B 3.0 to 3.2 min: 0% solvent B 3.2 to 5.0 min: 0% solvent B |
Reference molecules are prepared in a concentration of 0.5 mg/mL in 50% acetonitrile and 50% ammonium acetate pH 7.4 solution mixture. CHI IAM of reference molecules for calibration is measured with isocratic method to obtain a calibration curve.
More Readings
Ermondi, G., Vallaro, M., & Caron, G. (2018). Learning how to use IAM chromatography for predicting permeability. European Journal of Pharmaceutical Sciences, 114, 385–390.
Taillardat-Bertschinger, P. A., Carrupt, F., Barbato, B., & Testa, B. (2003). Immobilized Artificial Membrane HPLC in drug research. Journal of Medicinal Chemistry, 46, 655–665.
Giaginis, A., & Tsantili-Kakoulidou, E. (2008). Alternative measures of lipophilicity: From octanol/water partitioning to IAM retention. Journal of Pharmaceutical Sciences, 97, 2984–3004.
Valko, K., Du, C. M., Bevan, C., Reynolds, D. P., & Abraham, M. H. (2001). Rapid method for the estimation of octanol/water partition coefficient (log Poct) from gradient RP-HPLC. Current Medicinal Chemistry, 8, 1137–1146.
Valko, K., Rava, S., Bunally, S., & Anderson, S. (2020). Revisiting the application of immobilized artificial membrane (IAM) chromatography to estimate in vivo distribution properties of drug discovery compounds based on the model of marketed drugs. ADMET and DMPK, 8(1), 78.